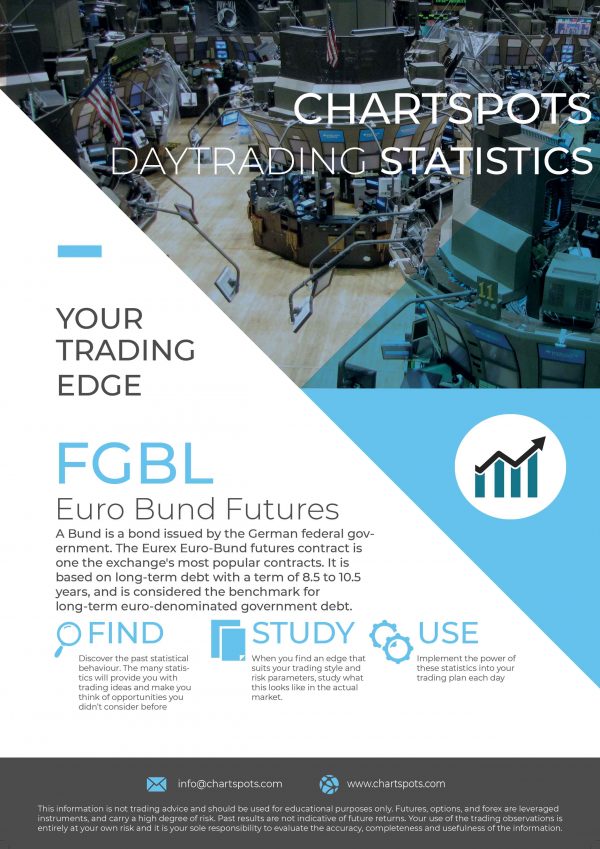
The essential toolkit for any professional Daytrader! Statistics covering Initial Balance, Range Extensions, Overnight statistics, Volume, 1 Min Rotations, and more – are all covered in this Premium Report.
The statistics have been gathered from 1 minute OHLCV (Open, High, Low, Close, Volume) data from the FGBL futures. The research can also be used for other derivatives of the Euro Bund like CFD’s, although it’s full potential is when used for trading FGBL.
Secure Checkout with Paypal
Improve your risk management by incorporating the product characteristics. Use stats on the 1 minute rotations to help with stop placement. Incorporating the statistics in your risk management enables better risk adjusted position sizing.
Our stats verify against prior day levels (VPOC, VAH/VAL, High/Low), given a specific opening scenario. This enables you to pick smarter targets. Incorporate the different intra-day ranges, like Initial Balance, Range extensions into realistic target selection.
Statistics will increase your Market Context awareness. You will have a better understanding of what is likely to happen, given a certain scenario. It sets you up for the Probabilistic mindset, crucial for any Trader.
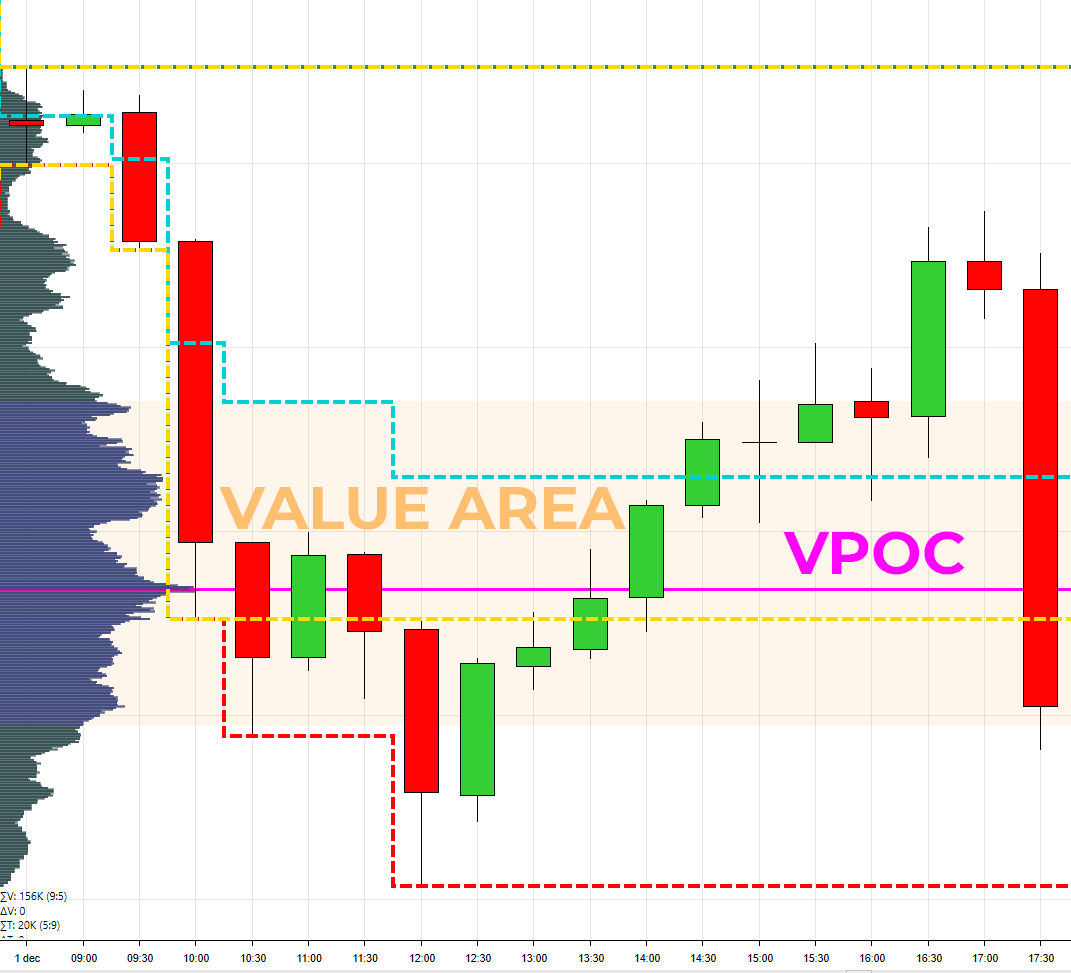
The statistical study examines probabilities linked to the location of the VPOC (Volume Point of Control – the most traded price).
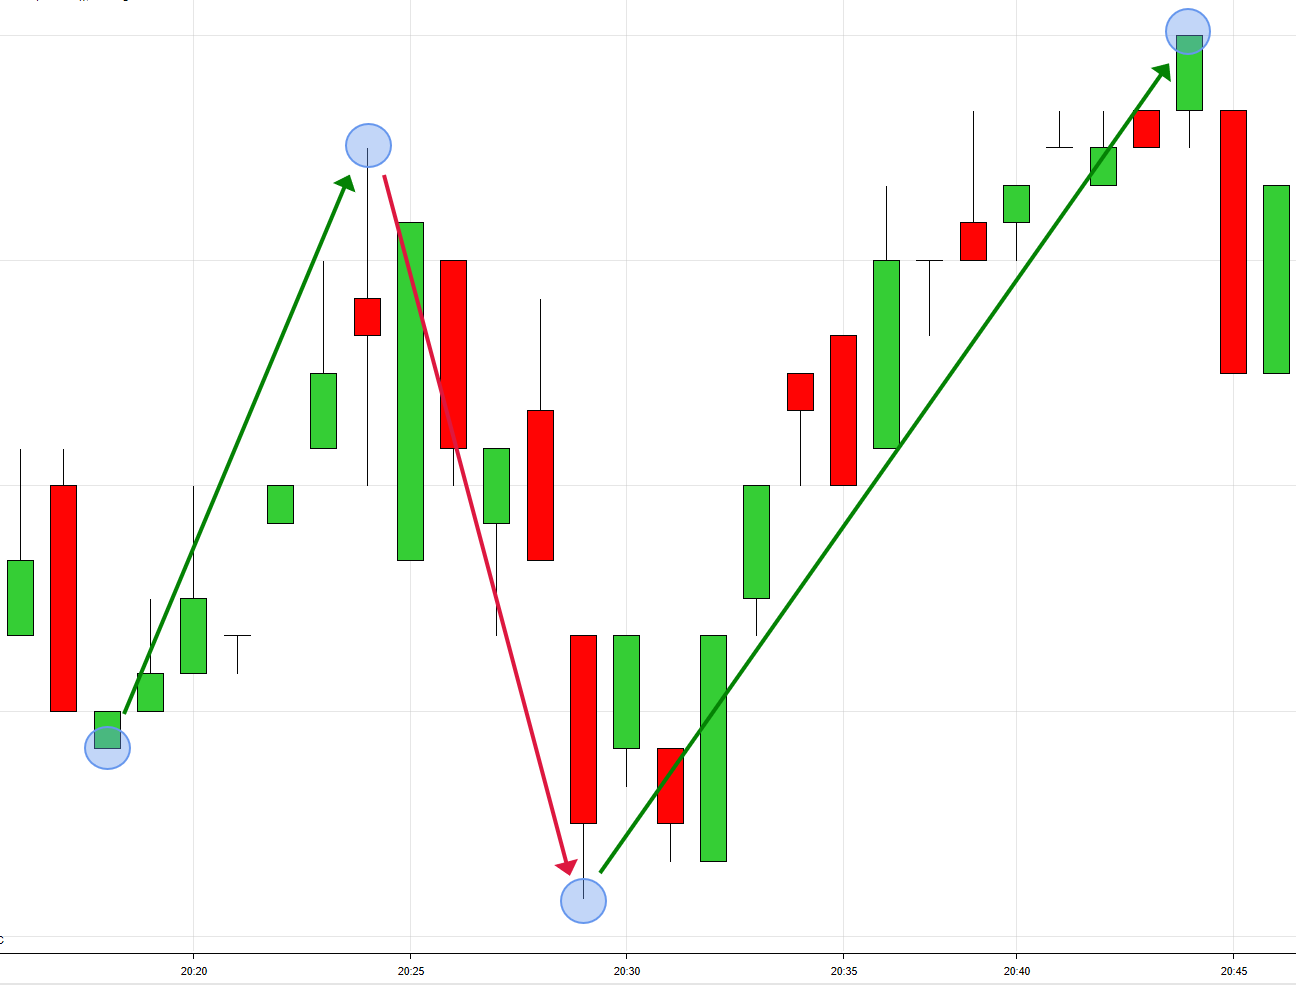
The statistical study examines a time based 5 minute opening range.
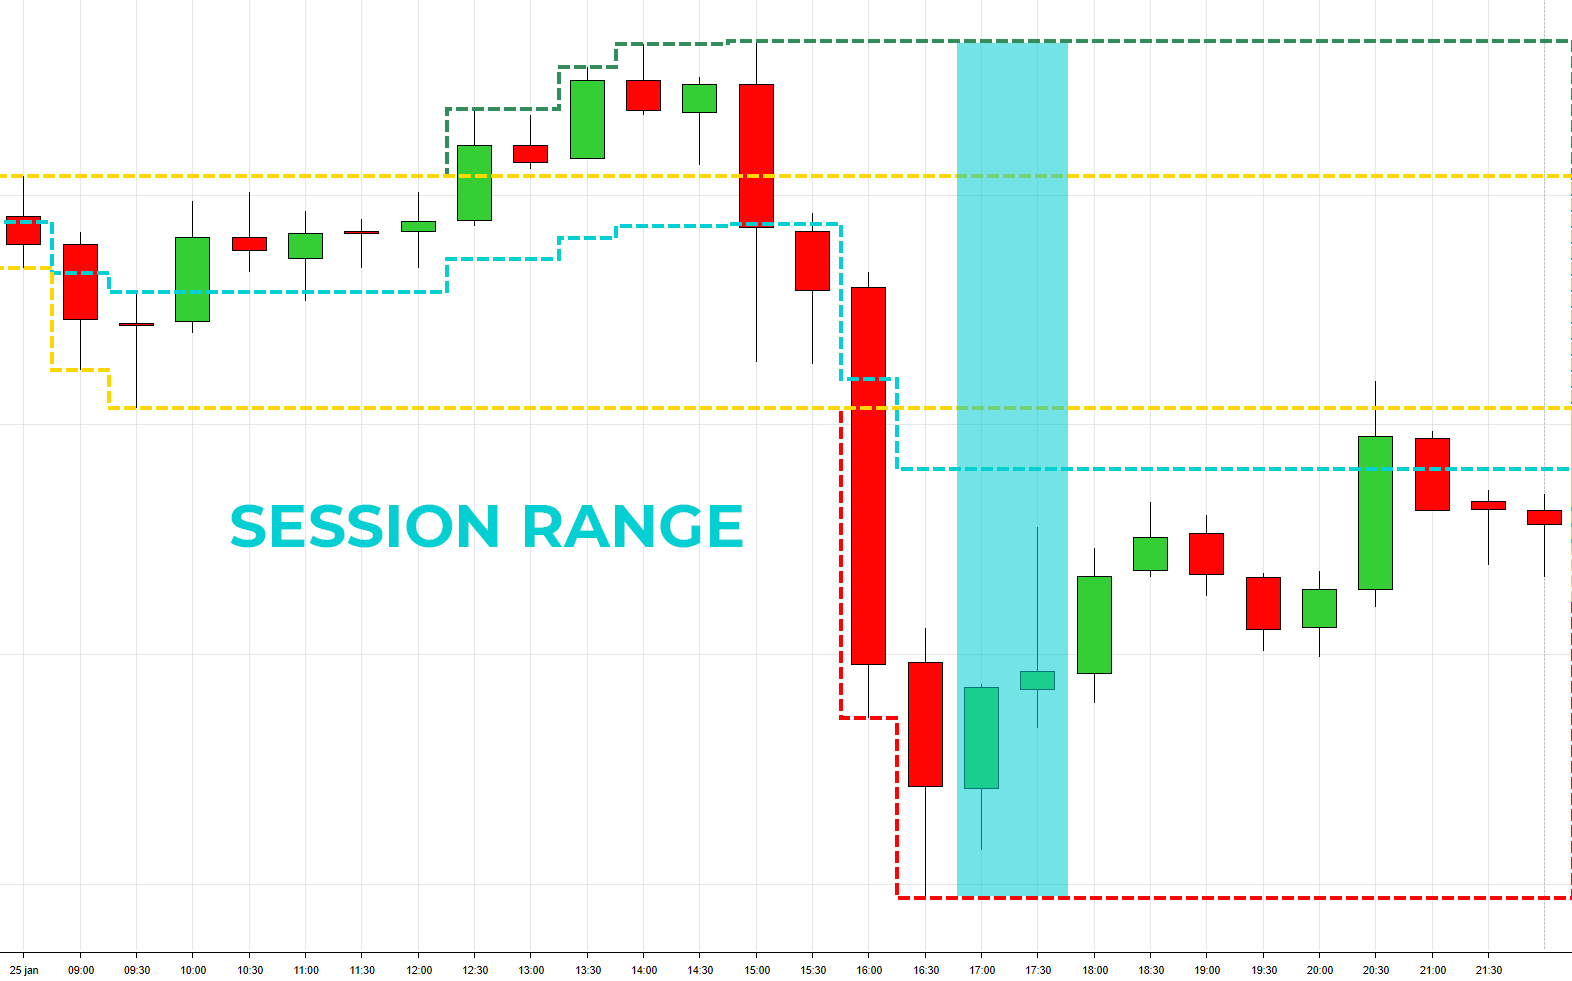
Session Range Distribution Chart and important stats like Average, Mode, Std Deviation and more
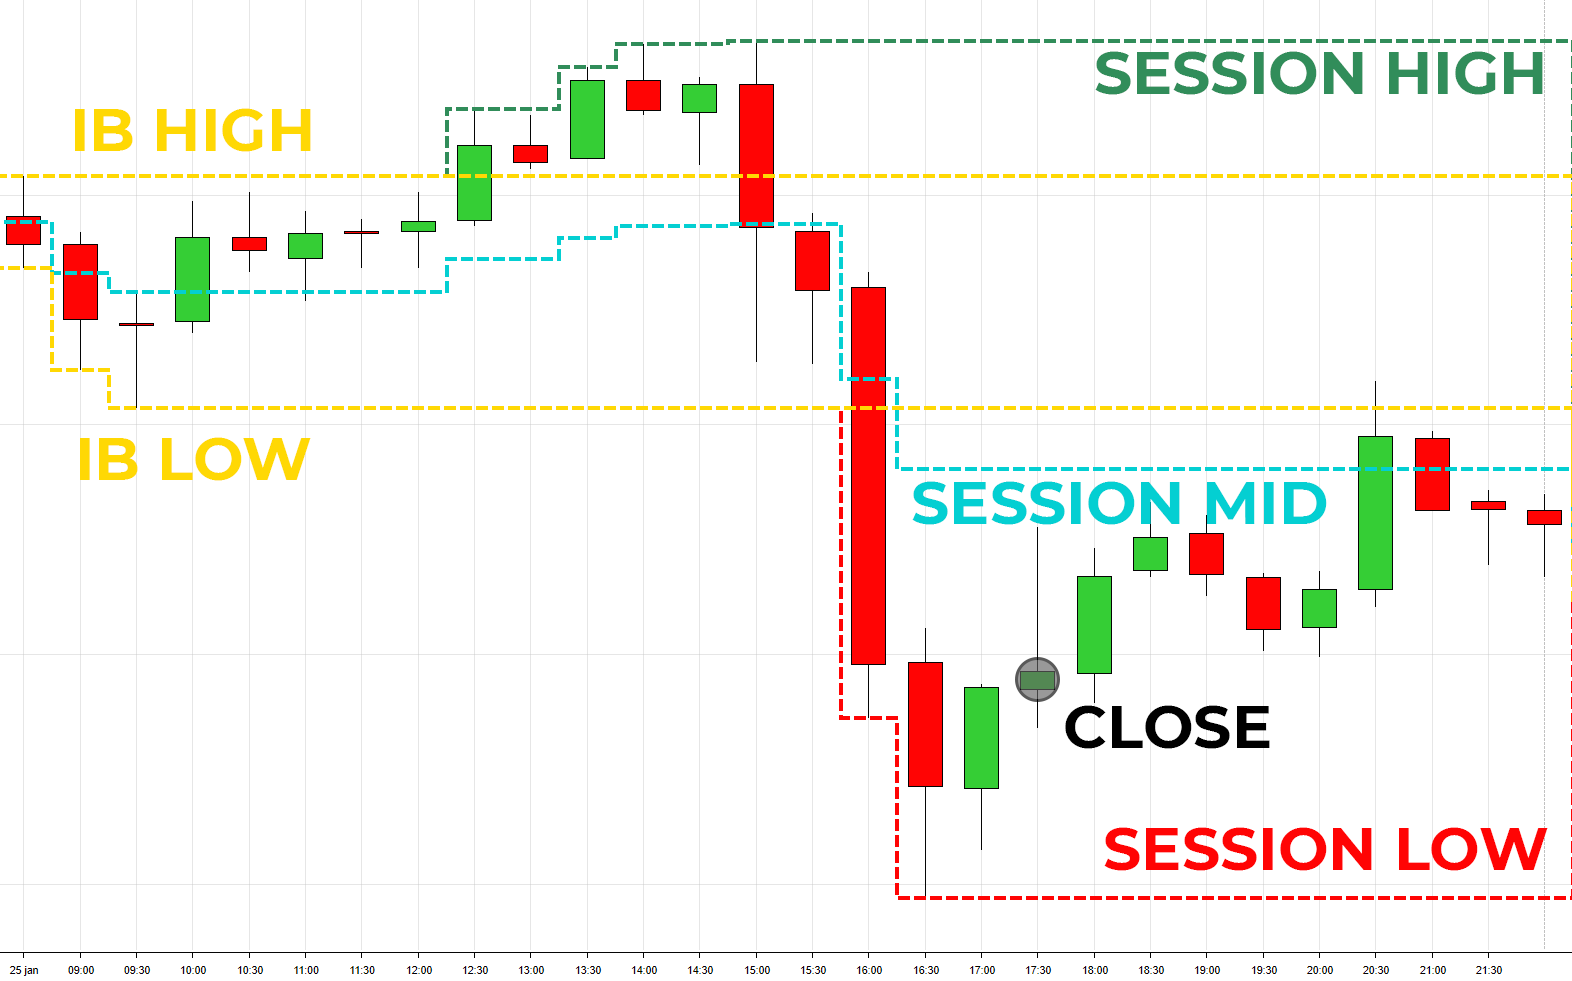
We evaluate the historical probabilities of the close compared to the Initial Balance and Mid, taking in to account the Day Types.

Historical Probabilities for Normal, Normal Variation, Trend and Neutral Days. Calculated across all data and for each weekday!

Evaluation of the historical probabilities surrounding Overnight reference points like the High & Low

Distribution Statistics for Session and Overnight Volume
Our analysis provides an answer to important questions like:
1. How often do we have a Trend day?
2. In case of a Gap Up, what are the probabilities of testing prior session price levels like, VPOC, Value Area High, … ?
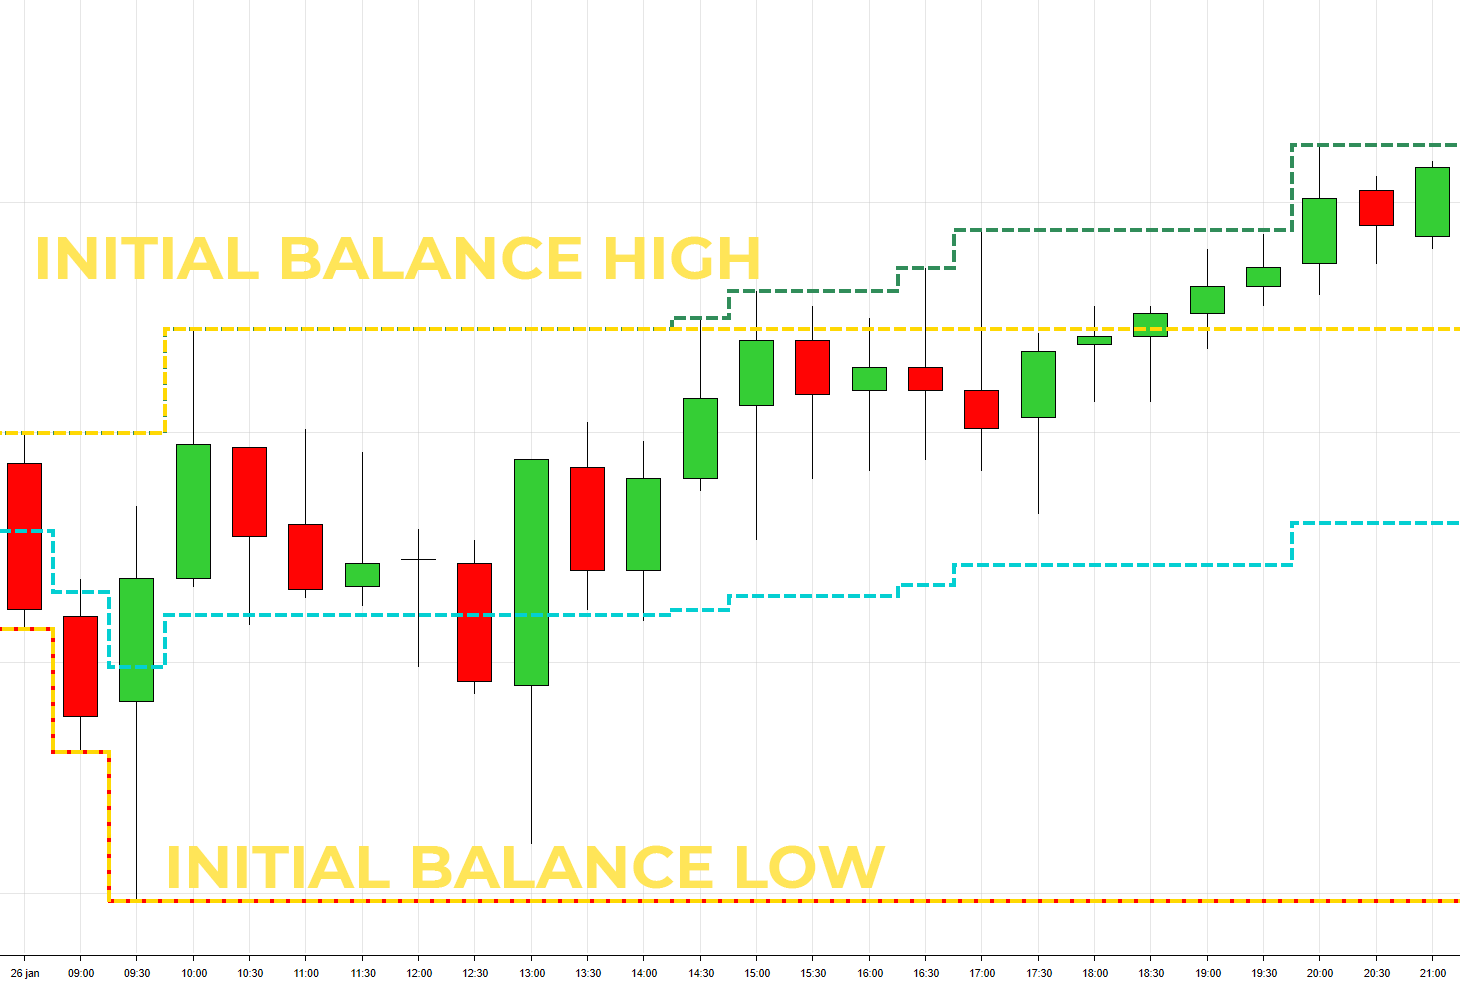
3. What is an average Initial Balance Range? And how is this distributed?
4. What are the 1 Minute Rotations looking like, what is considered a normal rotation? Is there a difference for up and down rotations?
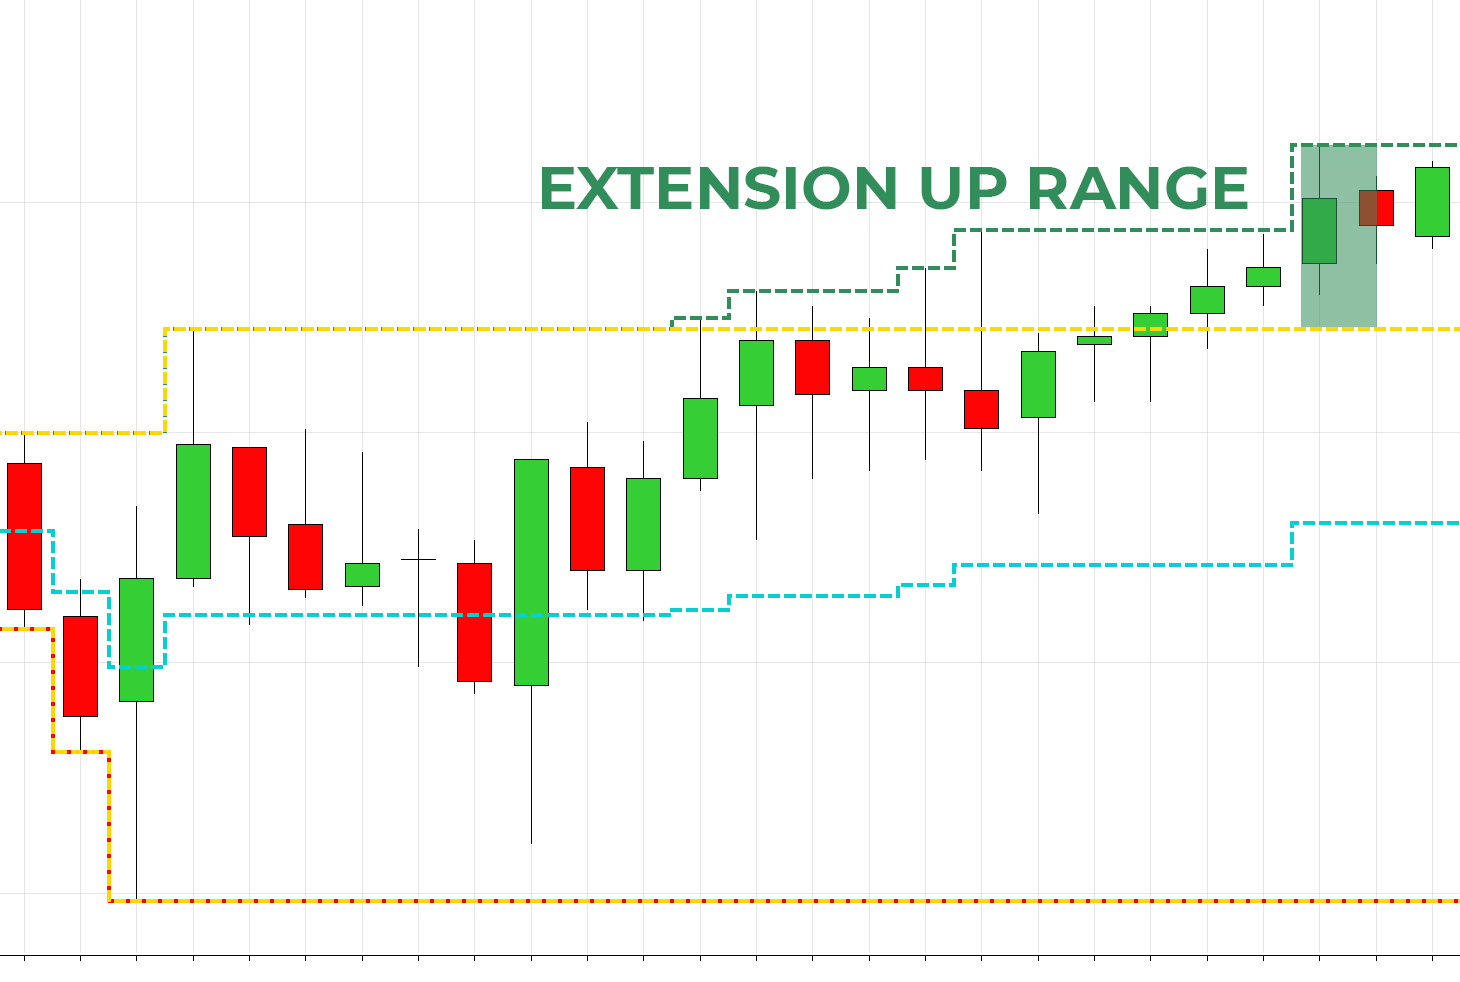
5. When we break the Initial Balance, How far do we typically go? What is an average Range Extension, and how are they distributed?
6. and many more…!
Yes! Contact us for more information.
Our analysis is based on the session (RTH) and extended hours (ETH) timeframes as specified by CME for US Index futures, and Eurex for EU Index Futures.
Initial Balance:
US Indexes: First hour of RTH
EU Indexes: 2 hours starting 8am CET (German Time).
CL: 9am – 10am Initial Balance, close at 2.30pm (Eastern Time)
Since late 2018 FDAX & FESX are also trading during the Asian hours, this is included in the overnight analysis.
Our statistics are calculated using 70% of the volume around the VPOC. The software uses the algorithm as specified by Market Profile to calculate the Value Area.
We are always open to suggestions! Contact us if you are looking for something specific
No! Currently all our products (Statistics & Indicators) have a 1 time payment.
Read our Disclaimer , Terms and Conditions and Privacy and Cookie Policy.
CFTC RULE 4.41 – HYPOTHETICAL OR SIMULATED PERFORMANCE RESULTS HAVE CERTAIN LIMITATIONS. UNLIKE AN ACTUAL PERFORMANCE RECORD, SIMULATED RESULTS DO NOT REPRESENT ACTUAL TRADING. ALSO, SINCE THE TRADES HAVE NOT BEEN EXECUTED, THE RESULTS MAY HAVE UNDER-OR-OVER COMPENSATED FOR THE IMPACT, IF ANY, OF CERTAIN MARKET FACTORS, SUCH AS LACK OF LIQUIDITY. SIMULATED TRADING PROGRAMS IN GENERAL ARE ALSO SUBJECT TO THE FACT THAT THEY ARE DESIGNED WITH THE BENEFIT OF HINDSIGHT. NO REPRESENTATION IS BEING MADE THAT ANY ACCOUNT WILL OR IS LIKELY TO ACHIEVE PROFIT OR LOSSES SIMILAR TO THOSE SHOWN.
GOVERNMENT REGULATIONS REQUIRE DISCLOSURE OF THE FACT THAT WHILE THE TRADING IDEAS AND TRADING METHODS SHOWN ON THIS WEBSITE MAY HAVE WORKED IN THE PAST; BUT PAST RESULTS ARE NOT NECESSARILY INDICATIVE OF FUTURE RESULTS. WHILE THERE IS A POTENTIAL FOR PROFITS THERE IS ALSO A HUGE RISK OF LOSS. A LOSS INCURRED IN CONNECTION WITH TRADING FUTURES CONTRACTS, STOCKS, OPTIONS OR FOREX CAN BE SIGNIFICANT. YOU SHOULD THEREFORE CAREFULLY CONSIDER WHETHER SUCH TRADING IS SUITABLE FOR YOU IN LIGHT OF YOUR FINANCIAL CONDITION SINCE ALL SPECULATIVE TRADING IS INHERENTLY RISKY AND SHOULD ONLY BE UNDERTAKEN BY INDIVIDUALS WITH ADEQUATE RISK CAPITAL.
RISK DISCLOSURE: FUTURES AND FOREX TRADING CONTAINS SUBSTANTIAL RISK AND IS NOT FOR EVERY INVESTOR. AN INVESTOR COULD POTENTIALLY LOSE ALL OR MORE THAN THE INITIAL INVESTMENT. RISK CAPITAL IS MONEY THAT CAN BE LOST WITHOUT JEOPARDIZING ONES’ FINANCIAL SECURITY OR LIFE STYLE. ONLY RISK CAPITAL SHOULD BE USED FOR TRADING AND ONLY THOSE WITH SUFFICIENT RISK CAPITAL SHOULD CONSIDER TRADING. PAST PERFORMANCE IS NOT NECESSARILY INDICATIVE OF FUTURE RESULTS
TESTIMONIAL DISCLAIMER: TESTIMONIALS APPEARING ON CHARTSPOTS.COM MAY NOT BE REPRESENTATIVE OF THE EXPERIENCE OF OTHER CLIENTS OR CUSTOMERS AND IS NOT A GUARANTEE OF FUTURE PERFORMANCE OR SUCCESS
ALL INFORMATION ON THIS WEBSITE IS PROVIDED FOR EDUCATIONAL PURPOSES ONLY AND NOT AN OFFER OR A RECOMMENDATION TO TRADE FUTURES CONTRACTS, STOCKS, OPTIONS OR FOREX.
Chart Spots values your privacy, have a look at our Privacy and Cookie Policy.
