Boost your trading game with ChartSpots’ Relative Volume (RVOL) indicator. Witness real-time volume insights and catch market moves early with our 2-week free trial!
Introducing the Relative Volume (RVOL) Indicator by ChartSpots – your new essential tool for pinpointed trading analytics.
What does it do?
Why should you care?
And the best part? We’ve added a visual treat! Our interactive screenshots showcase the RVOL indicator styled in two ways. The eye-catching orange dots and line demonstrate the volume average for the past 20 days, making trend analysis seamless.
Why ChartSpots? At ChartSpots, we’re driven by data. Our mission? Empowering YOU to unlock maximum trading potential. We believe in giving you advanced, precise statistics to sharpen your trading decisions. Whether you’re just starting out or you’re a seasoned pro, we’ve got the tools to elevate your trading journey. And guess what? Transparency is our mantra – no hidden fees, ever.
Dive in with our 2-week FREE trial! Experience firsthand the game-changing analytics of the RVOL indicator. Plus, our top-notch support team is on standby, ready to guide you at every step.
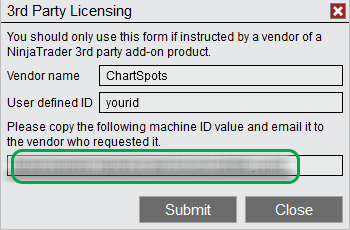
NinjaTrader® is a registered trademark of NinjaTrader Group, LLC. No NinjaTrader company has any affiliation with the owner, developer, or provider of the products or services described herein, or any interest, ownership or otherwise, in any such product or service, or endorses, recommends or approves any such product or service.
Read our Disclaimer , Terms and Conditions and Privacy and Cookie Policy.
CFTC RULE 4.41 – HYPOTHETICAL OR SIMULATED PERFORMANCE RESULTS HAVE CERTAIN LIMITATIONS. UNLIKE AN ACTUAL PERFORMANCE RECORD, SIMULATED RESULTS DO NOT REPRESENT ACTUAL TRADING. ALSO, SINCE THE TRADES HAVE NOT BEEN EXECUTED, THE RESULTS MAY HAVE UNDER-OR-OVER COMPENSATED FOR THE IMPACT, IF ANY, OF CERTAIN MARKET FACTORS, SUCH AS LACK OF LIQUIDITY. SIMULATED TRADING PROGRAMS IN GENERAL ARE ALSO SUBJECT TO THE FACT THAT THEY ARE DESIGNED WITH THE BENEFIT OF HINDSIGHT. NO REPRESENTATION IS BEING MADE THAT ANY ACCOUNT WILL OR IS LIKELY TO ACHIEVE PROFIT OR LOSSES SIMILAR TO THOSE SHOWN.
GOVERNMENT REGULATIONS REQUIRE DISCLOSURE OF THE FACT THAT WHILE THE TRADING IDEAS AND TRADING METHODS SHOWN ON THIS WEBSITE MAY HAVE WORKED IN THE PAST; BUT PAST RESULTS ARE NOT NECESSARILY INDICATIVE OF FUTURE RESULTS. WHILE THERE IS A POTENTIAL FOR PROFITS THERE IS ALSO A HUGE RISK OF LOSS. A LOSS INCURRED IN CONNECTION WITH TRADING FUTURES CONTRACTS, STOCKS, OPTIONS OR FOREX CAN BE SIGNIFICANT. YOU SHOULD THEREFORE CAREFULLY CONSIDER WHETHER SUCH TRADING IS SUITABLE FOR YOU IN LIGHT OF YOUR FINANCIAL CONDITION SINCE ALL SPECULATIVE TRADING IS INHERENTLY RISKY AND SHOULD ONLY BE UNDERTAKEN BY INDIVIDUALS WITH ADEQUATE RISK CAPITAL.
RISK DISCLOSURE: FUTURES AND FOREX TRADING CONTAINS SUBSTANTIAL RISK AND IS NOT FOR EVERY INVESTOR. AN INVESTOR COULD POTENTIALLY LOSE ALL OR MORE THAN THE INITIAL INVESTMENT. RISK CAPITAL IS MONEY THAT CAN BE LOST WITHOUT JEOPARDIZING ONES’ FINANCIAL SECURITY OR LIFE STYLE. ONLY RISK CAPITAL SHOULD BE USED FOR TRADING AND ONLY THOSE WITH SUFFICIENT RISK CAPITAL SHOULD CONSIDER TRADING. PAST PERFORMANCE IS NOT NECESSARILY INDICATIVE OF FUTURE RESULTS
TESTIMONIAL DISCLAIMER: TESTIMONIALS APPEARING ON CHARTSPOTS.COM MAY NOT BE REPRESENTATIVE OF THE EXPERIENCE OF OTHER CLIENTS OR CUSTOMERS AND IS NOT A GUARANTEE OF FUTURE PERFORMANCE OR SUCCESS
ALL INFORMATION ON THIS WEBSITE IS PROVIDED FOR EDUCATIONAL PURPOSES ONLY AND NOT AN OFFER OR A RECOMMENDATION TO TRADE FUTURES CONTRACTS, STOCKS, OPTIONS OR FOREX.