Whether you’re a seasoned veteran or a newcomer eager to make your mark, understanding the concept of Initial Balance is a game-changer in the world of day trading. But why is this seemingly simple concept so vital? Let’s break it down.
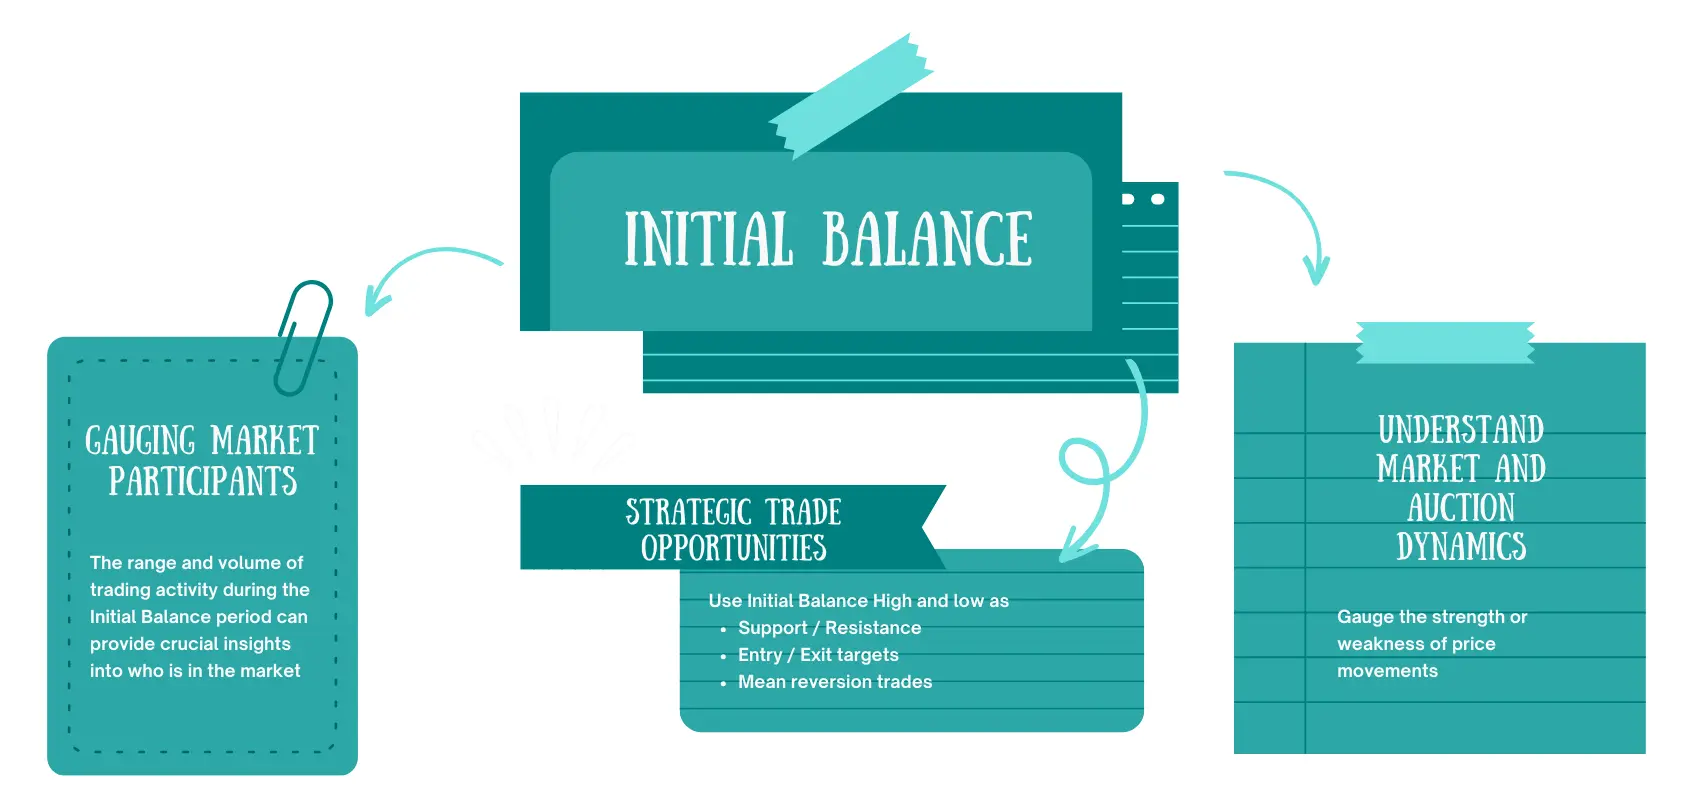
One of the most compelling reasons to understand Initial Balance is its ability to act as a barometer for market sentiment. The range and volume of trading activity during the Initial Balance period can provide crucial insights into who is in the market—whether it’s retail traders, institutional investors, or a mix of both. This information is invaluable for anticipating market behavior and trends.
The Initial Balance isn’t just a diagnostic tool; it also provides trading opportunities. The range established during this period often serves as a support or resistance level, providing traders with strategic entry and exit points. When the price breaks out of this range, either by extending above the Initial Balance High (IBH) or falling below the Initial Balance Low (IBL), it can signal a strong move in that direction given a supporting market context. Alternatively, in a market context where only short term traders appear to be active, it can provide opportunities of fading the break, and targeting mean reversion.
Understanding the Initial Balance also helps in framing the market and auction context for the day. It allows traders to gauge the strength or weakness of price movements, thereby helping in strategy formulation. For example, a narrow Initial Balance range with low volume might indicate a lack of conviction among traders, suggesting a potential sideways market. On the other hand, a wide range with high volume could signal strong interest and the possibility of a trending market.
In summary, the Initial Balance is not just another term to add to your trading jargon; it’s a powerful tool that can significantly impact your trading decisions and outcomes. So, stick around as we delve deeper into this fascinating topic, equipping you with the knowledge and strategies to make the most of Initial Balance in your day trading strategies.
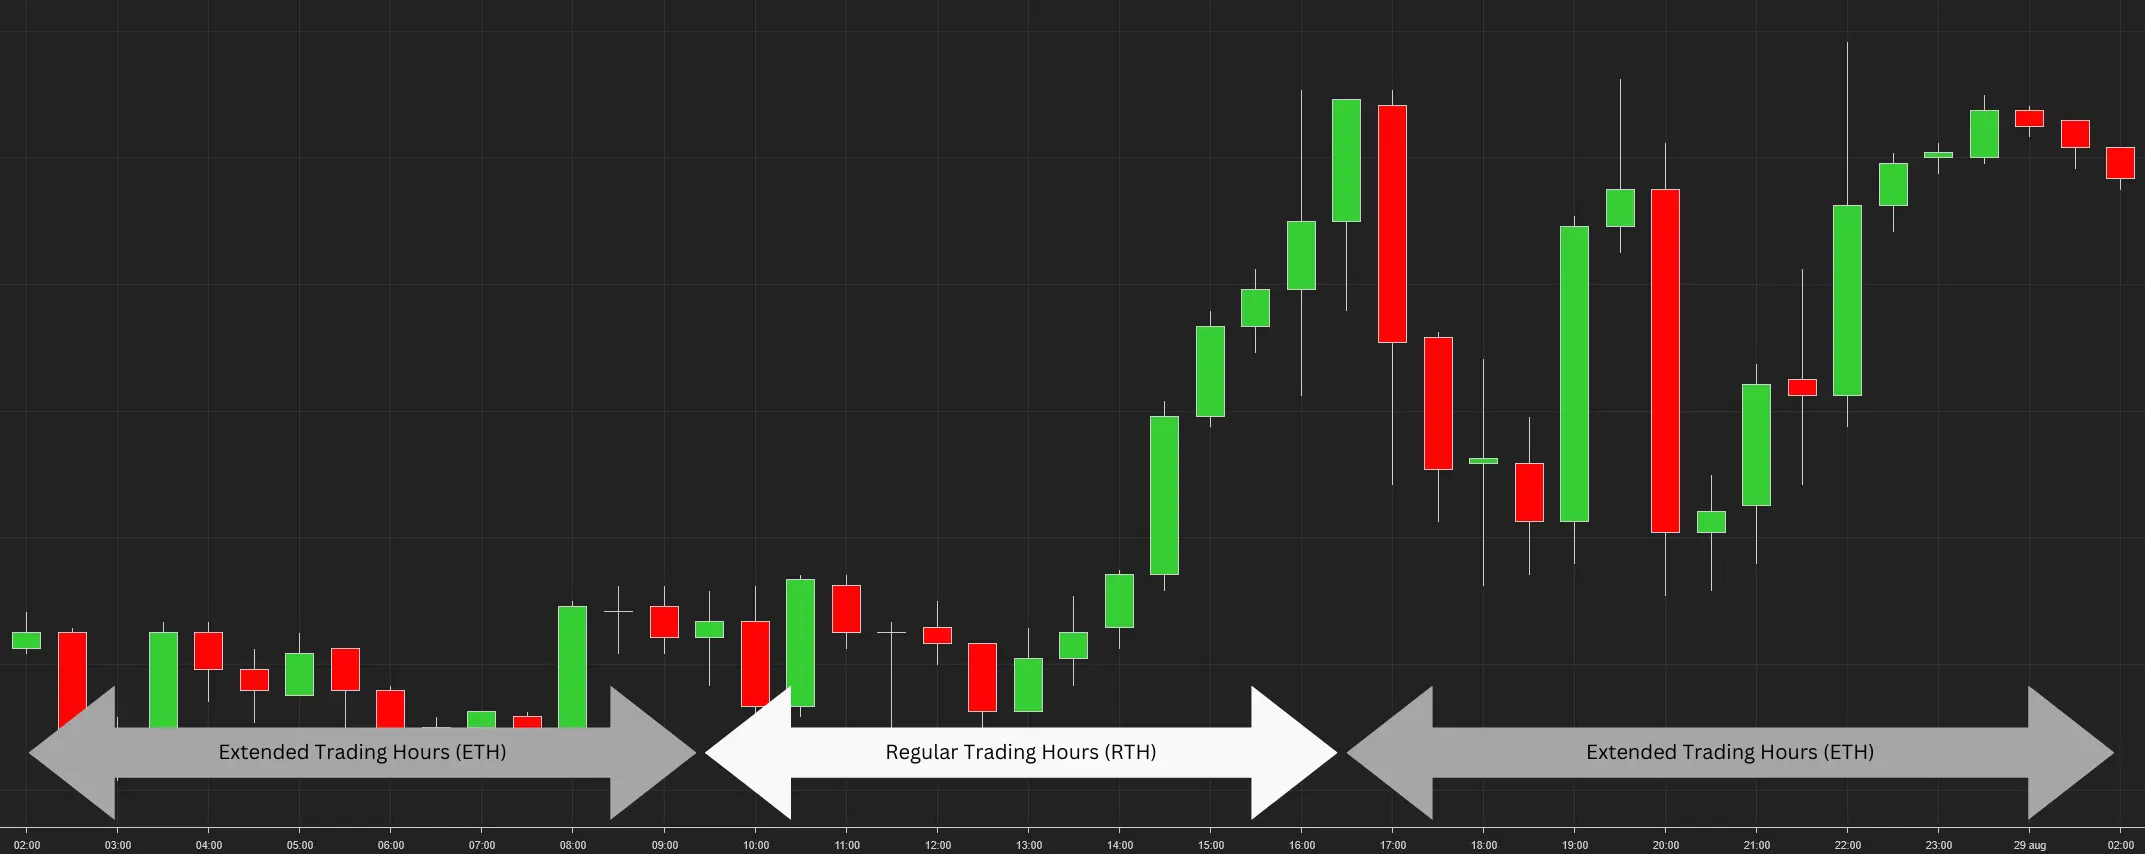
In the world of trading, a “session” refers to the specific time frame during which a financial market is open for trading. This is a critical concept to grasp because different markets have different session timings, and even within a single market, there can be multiple sessions. For instance, the U.S. stock market has a Regular Trading Hours (RTH) session that typically runs from 9:30 AM to 4:00 PM Eastern Time. However, trading doesn’t stop there; it merely shifts into Extended Trading Hours (ETH), which occur before the market officially opens and after it officially closes.
Understanding the nuances between Regular Trading Hours and Extended Trading Hours is crucial for several reasons:
During RTH, markets are generally more liquid, and trading volumes are higher. This is when the majority of institutional and retail traders are active, making it easier to enter or exit positions. On the other hand, ETH usually sees lower volumes, which can lead to higher volatility and wider spreads.
The RTH session is often considered the “main event” where the most accurate price discovery happens. This is because the higher volume and liquidity provide a more reliable snapshot of supply and demand. ETH can offer early clues about market direction but should be approached with caution due to lower liquidity.
Different trading sessions may require different strategies. For example, a strategy that works well during RTH when volume is high may not be as effective during ETH. Understanding the characteristics of each session can help traders adapt their strategies for better results.
Understanding the Initial Balance is like having a roadmap for the trading day ahead. It provides crucial landmarks that can guide your trading decisions. Let’s dissect what makes up the Initial Balance and why each component is vital for traders.
The Initial Balance (IB) is the price range established during the first hour of the trading session. It serves as a microcosm of market activity, capturing the initial flurry of trades that occur as the market opens. This range is often used as a reference point for the rest of the trading day, providing traders with valuable insights into market sentiment, potential volatility, and key levels for trading opportunities.
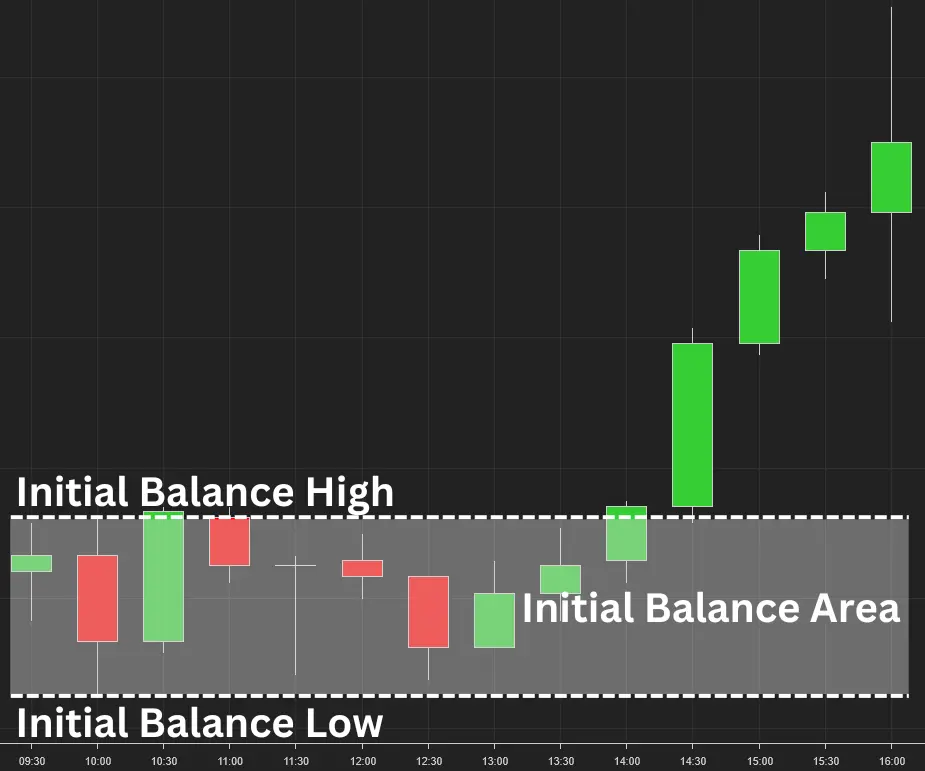
Two critical landmarks within the Initial Balance are the Initial Balance High (IBH) and Initial Balance Low (IBL). These are the highest and lowest price points, respectively, reached during the first hour of trading. These levels are not just random data points; they serve as psychological barriers that the market may test throughout the trading session.
The area between the IBH and IBL is known as the Initial Balance Area. This is the playground where much of the day’s trading activity may occur. Traders often use this area to set their trading strategies for the day. For instance, a breakout above the IBH could be a bullish signal, prompting traders to consider long positions. Similarly, a breakdown below the IBL could indicate bearish sentiment, leading traders to explore short-selling opportunities.
The Initial Balance Area is not just about price levels; it’s also about understanding market dynamics. The width of this area can indicate the level of volatility and trader participation. A narrow Initial Balance Area might suggest low volatility and a potential range-bound market, while a wide area could indicate high volatility and the possibility of significant price movements.
A distribution chart of the Initial Balance can be an invaluable tool for traders. It provides a visual representation of how often specific Initial Balance ranges occur over a given period. This can help traders identify patterns and anomalies that may not be immediately apparent from raw data alone. At Chart Spots, we’re in a unique position to offer these insights, thanks to our extensive research and quantitative data analysis on this topic. Our yearly reports provide a snapshot of these statistics on a fixed data set, giving traders a robust understanding of historical trends. Our MarketStats platform offers daily updated statistics, allowing you to configure how much data (ranging from months to years) you’d like to use for generating these statistics.
In the image below, you can see the that the most common range from August 31, 2018 to August 31, 2023 in the ES was 13.5 points with 18 occurrences in the sample set. The normal range, 1 standard deviation from the mean in this period was 4.11 to 43.21. This is crucial information to gauge the Initial Balance range and the clues it provides as to who is participating in the auction. Is the current Initial Balance range outside of the normal range?
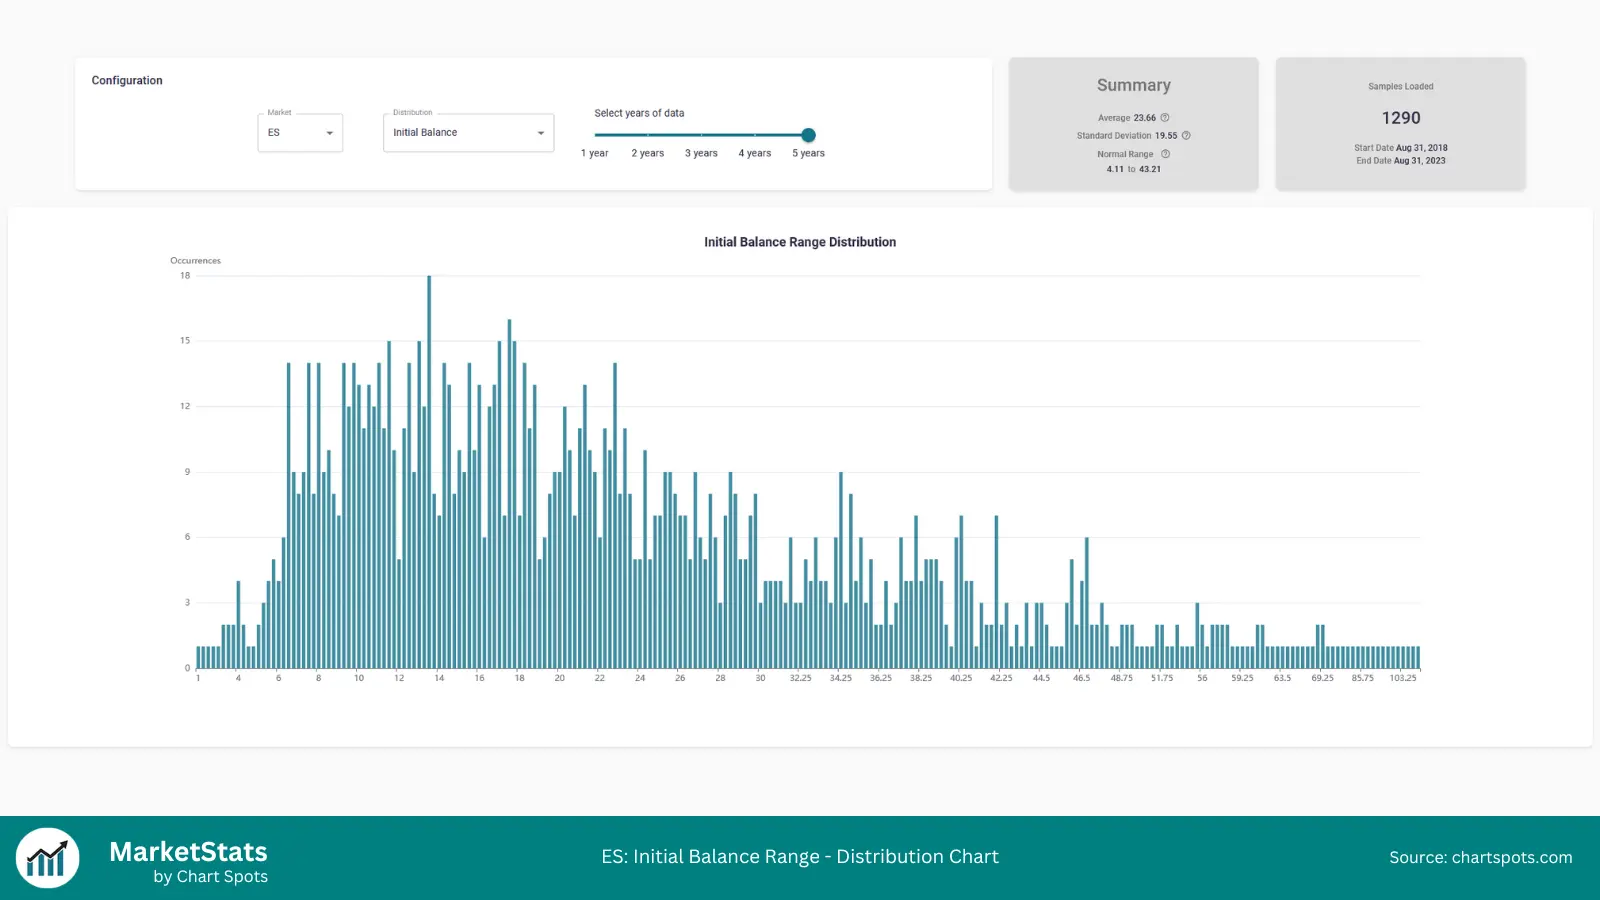
Image: Initial Balance Distribution Chart
Understanding high-probability scenarios based on Initial Balance statistics can significantly enhance your trading strategies. These scenarios can be leveraged to identify potential breakouts or breakdowns, providing traders with timely entry and exit points.
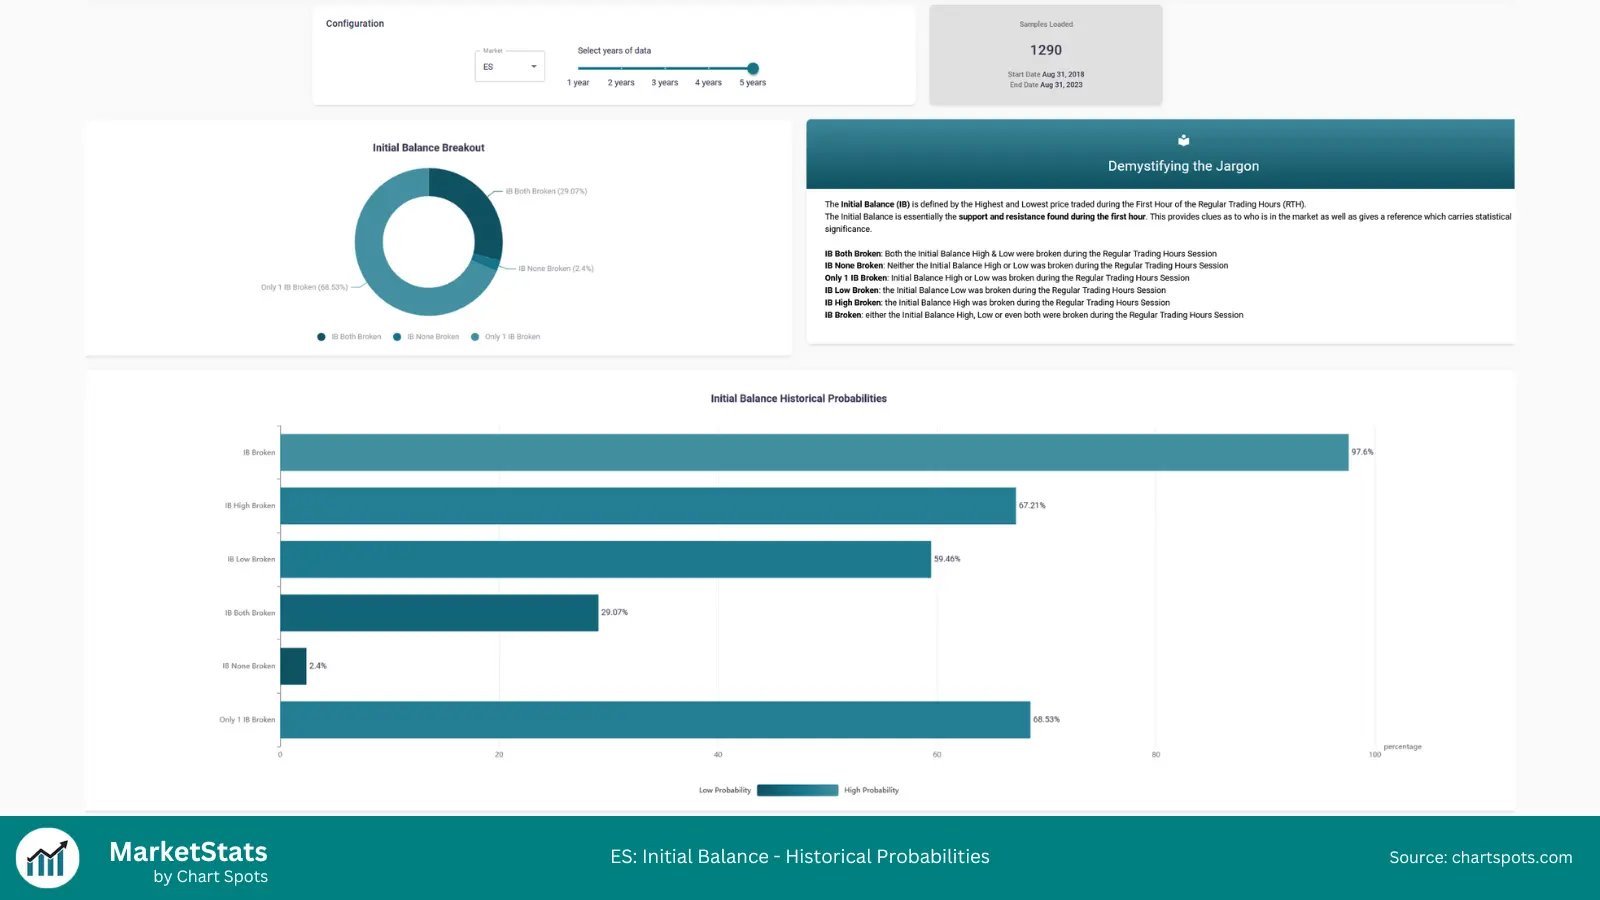
Image: Different scenarios on the Initial Balance with low and high probability
For those who want a more in-depth explanation of these statistics, the MarketStats platform is the place to go. You can sign up for a free account to explore a wealth of data and insights that can help you make more informed trading decisions.
Initial Balance statistics offer a data-driven approach to understanding market behavior. They provide traders with a statistical edge, helping to identify high-probability trading opportunities. With the power of Chart Spots’ extensive research and the statistics published on our MarketStats platform, traders are better equipped to navigate the complexities of the market and make more informed decisions.
Navigating the complexities of Initial Balance and other key trading levels can be a daunting task. Manually tracking and updating these levels across multiple charts and timeframes not only consumes invaluable time but also introduces the risk of accuracy issues. The last thing any trader wants is to miss out on a lucrative opportunity or make a costly error due to manual tracking inefficiencies. That’s where NinjaTrader 8 and Chart Spots’ Initial Balance & Daily Levels Indicator come into play. This tool is engineered to alleviate the pain points associated with manual tracking, offering traders a comprehensive and automated view of the market.
Understanding the timing for the Initial Balance in different markets is crucial for adapting your trading strategies. Here’s an expanded table that outlines the Regular Trading Hours (RTH) and Initial Balance timings for some of the most commonly traded futures markets:
| Market Name | Ticker Symbol | Time Zone | RTH Start Time | RTH End Time | Initial Balance Start Time | Initial Balance End Time |
|---|---|---|---|---|---|---|
| E-mini S&P 500 | ES | EST | 9:30 AM | 4:00 PM | 9:30 AM | 10:30 AM |
| E-mini Nasdaq 100 | NQ | EST | 9:30 AM | 4:00 PM | 9:30 AM | 10:30 AM |
| E-mini Russell 2000 | RTY | EST | 9:30 AM | 4:00 PM | 9:30 AM | 10:30 AM |
| Dow Jones Industrial Avg | YM | EST | 9:30 AM | 4:00 PM | 9:30 AM | 10:30 AM |
| Crude Oil | CL | EST | 9:00 AM | 2:30 PM | 9:00 AM | 10:00 AM |
| DAX Futures | FDAX | CET | 8:00 AM | 10:00 PM | 8:00 AM | 10:00 AM |
| Euro Bund | FGBL | CET | 8:00 AM | 6:00 PM | 8:00 AM | 10:00 AM |
| Euro Stoxx 50 | FESX | CET | 8:00 AM | 10:00 PM | 8:00 AM | 10:00 AM |
For DAX Futures (FDAX), Euro Stoxx 50 (FESX) and Euro Bund (FGBL) the Initial Balance is caculated over the first two hours of trading. This is because the underlying product (stocks or bonds) for these indices start to trade only as of 9:00 AM CET. Alternatively, one could assess the Initial Balance for these futures from 9:00 AM CET to 10 AM CET.
For traders interested in the E-mini S&P 500 (ES), the Initial Balance is generally established between 9:30 AM and 10:30 AM Eastern Time. This one-hour window is crucial for setting the tone for the rest of the trading day. Many traders use this period to identify potential breakouts or breakdowns, set stop-loss levels, and fine-tune their trading strategies.
As we wrap up this comprehensive guide on Initial Balance trading, let’s summarize the key points that can help you navigate this crucial aspect of day trading more effectively.
Mastering the concept of Initial Balance can be a game-changer in your trading journey. It not only provides a snapshot of market sentiment but also offers a framework for identifying trading opportunities and making data-driven decisions. Armed with the right tools, data, and understanding, you can use Initial Balance as a powerful asset in your trading arsenal.