
Find comparable sessions, test your trade rules and turn the results into a plan for the next open.
Free accounts include worked studies. Pro tools are shown here.
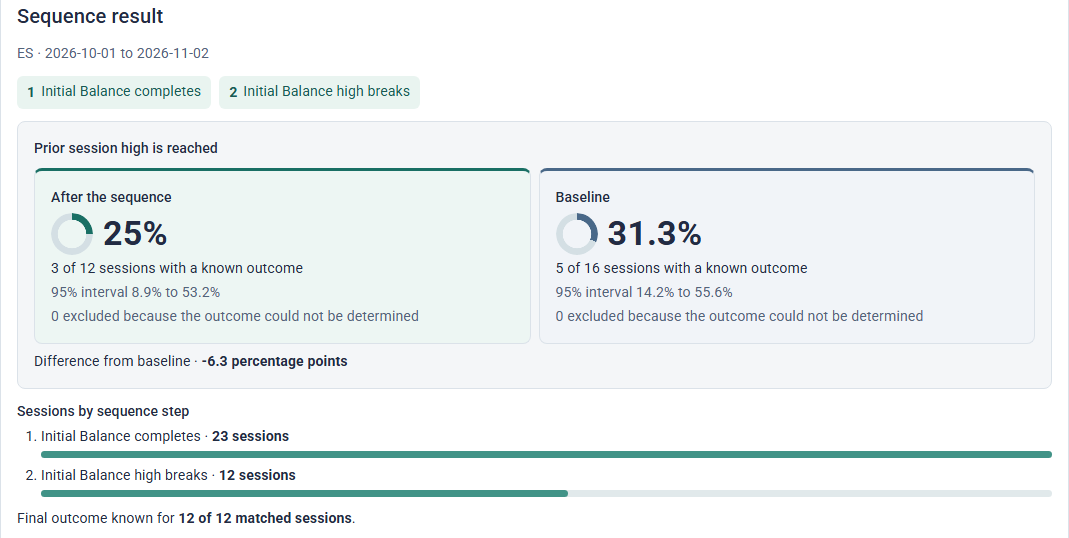
The Initial Balance (IB) is the first hour’s range. In this ES study, price broke above that range within an hour of its formation.
Choose an outcome to see how those early breaks compare with all high breaks over the following hour, up to session close.
E-mini S&P 500 futures (ES) · July 6–November 2, 2026
87.0% after any IB high break · 47 of 54
A return was common with either timing. The early-break filter changed the observed rate by only 2.4 percentage points.
25.9% after any IB high break · 14 of 54
Reaching the prior session high was much less common. Switching the outcome keeps the setup and observation window fixed.
Go long at the next minute’s open after the first hour ends. Keep the 10-tick stop and switch the profit target across the same 23 simulated trades.
60-minute cap · 1 tick commission · 1 tick slippage per trade.
EURO STOXX 50 futures (FESX) · October 1–November 2, 2026 · Historical simulation
8 target first · 8 stop first · 7 timed out
The larger target paid more when reached. Seven trades ran to the time limit, so target hits alone do not explain the result.
12 target first · 7 stop first · 4 timed out
The closer target was hit more often. Those smaller wins produced a lower average after modeled costs.
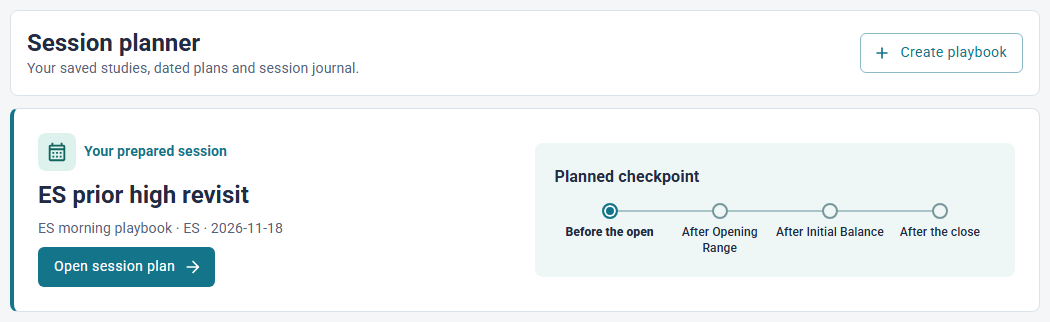
Attach a saved study to a dated plan and choose when to check it. Here, an ES trader prepares to watch for a revisit of the prior session high.
Apply one checkpoint to two sessions. Start with the rule, then open each dated note to see where price ended up.
Mark the high and low of the Initial Balance. Start the observation only if price breaks above that high within the next hour.
Record one outcome. Did price trade back inside the range within 60 minutes of the break, or by session close if earlier?
On October 29, 2026, E-mini S&P 500 futures broke the IB high in time, then traded back inside during the observation window.
Session note · Checkpoint met. Return observed.
On October 27, 2026, E-mini Nasdaq-100 futures also broke the IB high in time. Price stayed outside through the observation window.
Session note · Checkpoint met. No return observed.
Filter by the opening location, then compare the outcome with all eligible sessions. For example, when ES opens above yesterday’s high, how often does the session range include that level?
Reference Level Explorer · Choose a level such as the prior high or low and study whether and when price reaches it after an event.
Start from one event sequence and compare several later outcomes with their baselines. Look at eligible counts before giving weight to a difference.
IB/OR Extension Explorer · Test how often price extends a fraction or multiple of the Initial Balance or Opening Range. Range Projection shows the distribution of subsequent movement over a chosen time window.
Keep the entry, stop, target and cost assumptions fixed across an earlier period and a later one. Read the number of trades alongside the average result in each period.
Target & Stop Lab · Compare exit choices on the same entries, including trades that time out before either level is reached.
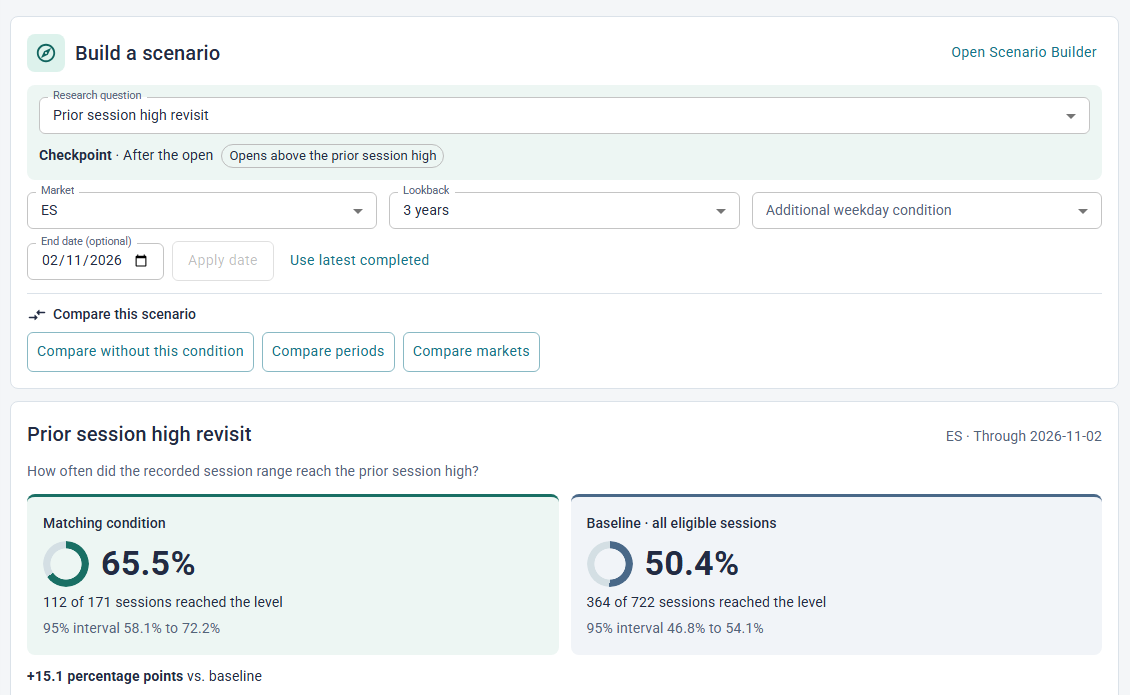
Open a worked example, change a setting and inspect the sessions behind the result.
Compare Pro access for custom research and playbook planning.