Hello there, trading enthusiasts! We’re excited to share the latest update that we’ve rolled out on our MarketStats platform – introducing three new types of heatmaps: Trend, Range, and Volume heatmaps.
First off, we’ve designed the Trend heatmap to give you an in-depth understanding of futures contract price movements. It’s quite simple and visually appealing – lighter shades denote price increases, while darker shades signify decreases. This comparison between the opening and closing prices within your chosen timeframe should help you quickly grasp if the price moved up or down.
Then there’s the Range heatmap, your new ally for assessing the market’s volatility. It does so by calculating the difference between the highest and lowest prices within a specific period. The color-coded data brings forth an easily comprehensible visual depiction of the price range, invaluable in chaotic market conditions.
Lastly, we present the Volume heatmap, an innovative tool to visualize the intensity of trading activity. By illustrating the total number of contracts traded in various color tones, you’ll quickly identify periods of high or low market participation.
These heatmaps are available for all our supported futures contracts (ES, NQ, CL, FESX, FDAX, FGBL), across multiple timeframes (15, 30, 60 minutes) and data ranges (from 1 to 4 weeks of minute data).
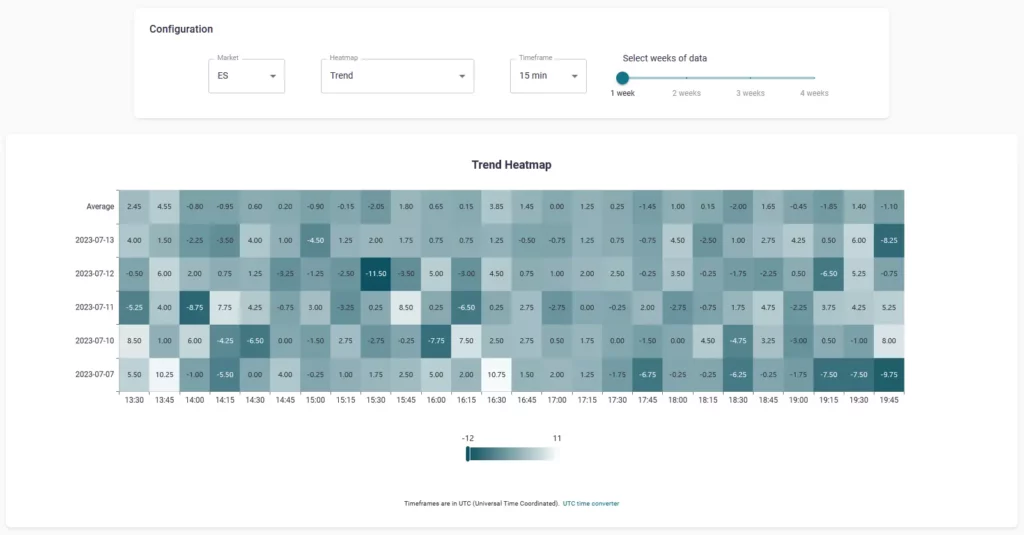
To give you a peek into how these tools can change your trading game, check out this screenshot of a Trend heatmap for ES using a week’s worth of data in a 15-minute timeframe. You’ll notice all positive values for the second 15-min window, which also lead to another positive result the next day. This is just a taste of the countless profitable strategies you could devise using our new heatmaps.
At ChartSpots, our goal has always been to provide you with the most advanced statistical tools and dynamic indicators, helping you optimize your strategies and unearth profitable trade opportunities. And we strongly believe these new features will bring us a step closer to that mission.
We encourage you to try out these new features and unlock the next level of data-driven trading. Let these heatmaps guide your way to improved market understanding and better trading outcomes. As always, if you have any questions, our team of experts is here to help.
Happy trading!